Winter Weather Outlook 2024-2025
November 1, 2024
Meteorologist Rich Lupia
Hey there! Yep… It is that time of year. Time to dig into what exactly will happen this upcoming winter. This outlook and the revisions (if any) that will come to it in the next 15-30 days will be a great likelihood of weather over the next 90-120 days. This is the meat of our winter. The heavy snow portion of our winter. The “get out and ride” portion of our winter. Before we dive in, I would like to thank Bill Kardas from WKTV for his assistance, the NWS local office here in Greenville-Spartanburg, SC, and all my friends and family from the Carolinas to Upstate NY with the creation of this product. Now, HERE WE GO!
SNOWFALL SO FAR THIS SEASON
How much snow we have had since September to now gives us somewhat of an idea of what is to come. It gives us an idea. Not 100% accurate but it’s a lot better than all that crap that is thrown around in July and August! You guys know exactly whom you are 🙂
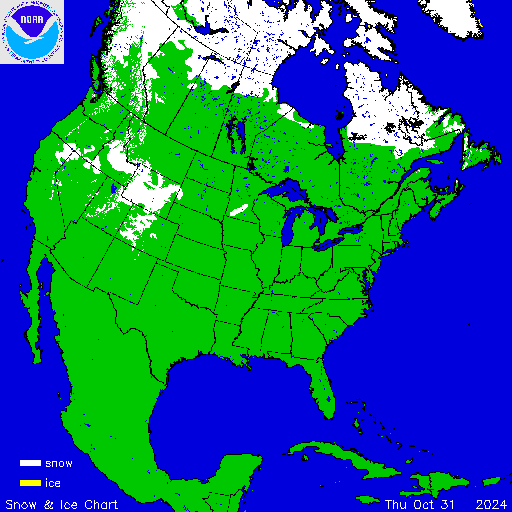
As you can see, we have some snow. Not much of it but at least we have some of it out there, particularly in the Western US where they are dealing with a pronounced cold snap this week and into next week. Lets take a look at where we have been in recent years:
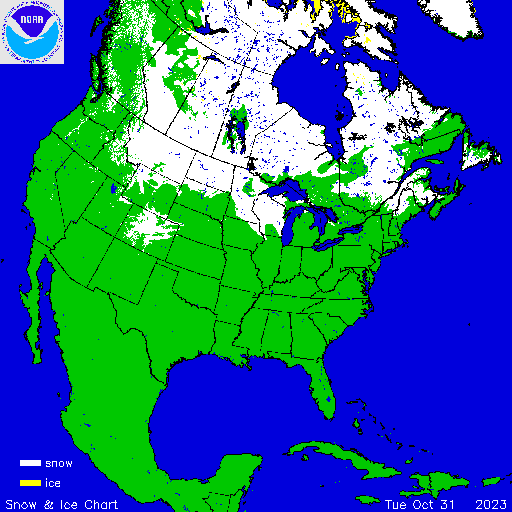
Now this one looked better. Certainly on our half of the country. How did it work out for most of the winter? *BUZZER* In fact, if it was not for the sudden cold snap at the end of March going into April that brought the heaviest snows of the year (much like Colorado), we could have ended up with a potentially record low snowfall for 2023-24. Even with the late rush of snow, we had less that 50 inches for the year. Or about 50% of what we should have had. Lot of trouble riding on that!
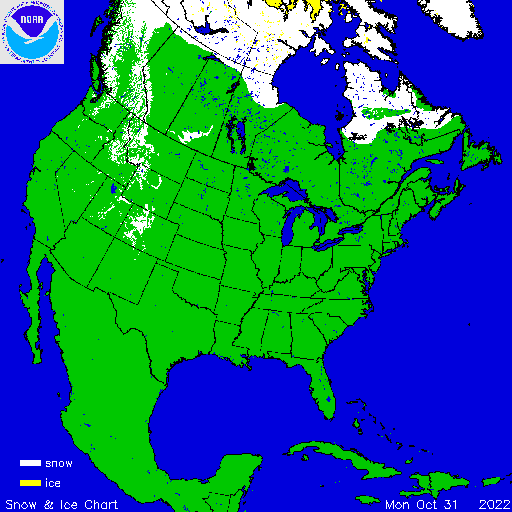
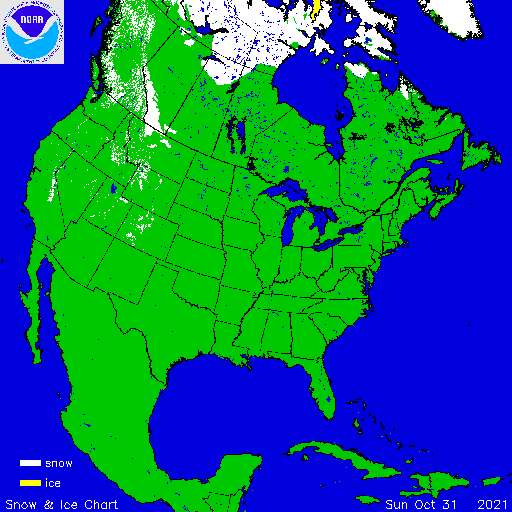
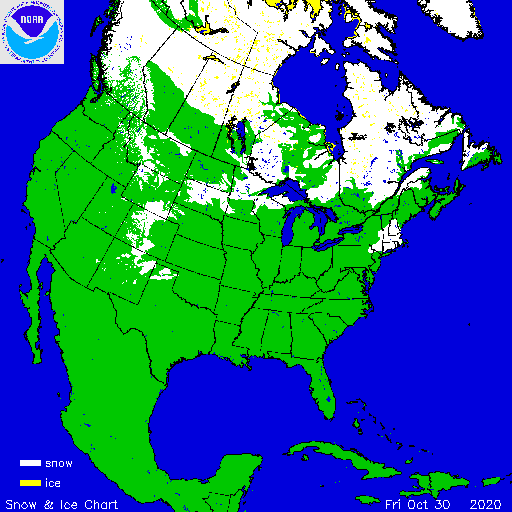
Honestly 2020-21 looks decent. Indeed for some weeks at the end of January and especially into February of 2021, riding conditions were good if not excellent for that 4-6 week period. The problem we had: WE WERE UNDER COVID LOCKDOWNS. For out of staters (like me), if we entered New York State at all for any reason, we were to immediately quarantine for 2 weeks. If not we were subject to arrest and jail. That was lifted on April 1st. Literally the end of the season. What a bummer!
But the bottom line with all of this is: Our snowfall numbers have fallen. Every single year. Since 2016-17. Whether it is by a few inches or by a lot of inches, they have fallen every single year. We are now to the point to where there almost isn’t a need to do a winter weather outlook anymore. So why am I doing it now?
Things change. Not every year is the same. This is the year of change!
This fall has turned out to be dry. Very dry. It is so dry that it has not been like this since the year 2000. The record highs that we literally just saw yesterday with it near 80. On Halloween. That is true summer warmth! That is also about as warm as it can get this late in the season in Upstate NY. The last time we got up into this range? 74 degrees. Set back in 2003.
Ok so the fall of 2000. Then the fall of 2003. What happened in both of the following winters? Both of them were decidedly ABOVE NORMAL! In the case of 2000-01, it felt like it would never stop! 2003-04 was harsh as well, particularly January 2004. That month was one of a few that had an average temperature BELOW 10 DEGREES.
Am I saying that since we have 2000-01 and 2003-04 on our side that we are suddenly going to get super cold and super snowy? NO. Not necessarily. However, what caused us to get so snowy those years, that definitely has to be considered.
Take a look at the WKTV weather records for winter. Since 1980.
This comprehensive weather record filing will give you an idea of what I am talking about. Check out the big snow years from 1992-93 to 2010-11. During that period a majority of seasons were at or above normal. Since 2011, a majority of seasons are at to below normal. Also in the 1980s, a majority of seasons are at to below normal. And you know without looking at it from the Blizzard of ’66 to 1979, those years were decidedly at to above normal
| SNOWFALL FOR UTICA/ROME, NY | Oct | Nov | Dec | Jan | Feb | Mar | Apr | May | ||||
| 1980-81 | 58.1 | 16.0 | 7.4 | 8.9 | 0.3 | 0.0 | 32.6 | |||||
| 1981-82 | 74.4 | 0.9 | 2.7 | 15.1 | 18.9 | 12.3 | 18.4 | 6.1 | 0.0 | 74.4 | ||
| 1982-83 | 45.6 | 2.0 | 2.1 | 13.4 | 8.6 | 7.8 | 11.7 | 0.0 | 0.0 | 45.6 | ||
| 1983-84 | 85.3 | 0.0 | 7.3 | 19.5 | 20.0 | 15.1 | 23.4 | 0.0 | 0.0 | 85.3 | ||
| 1984-85 | 73.3 | 0.0 | 3.3 | 25.1 | 24.1 | 9.0 | 9.3 | 2.5 | 0.0 | 73.3 | ||
| 1985-86 | 99.7 | 0.0 | 8.5 | 27.3 | 29.5 | 19.7 | 13.0 | 1.6 | 0.1 | 99.7 | ||
| 1986-87 | 85.1 | 0.0 | 14.0 | 15.4 | 44.6 | 5.9 | 2.7 | 2.5 | 0.0 | 85.1 | ||
| 1987-88 | 71.7 | 4.0 | 6.6 | 15.0 | 12.4 | 29.5 | 3.5 | 0.7 | 0.0 | 71.7 | ||
| 1988-89 | 60.2 | 1.2 | 0.2 | 18.5 | 16.7 | 15.4 | 6.6 | 1.6 | 0.0 | 60.2 | ||
| 1989-90 | 92.4 | 0.0 | 5.9 | 20.9 | 34.5 | 22.2 | 5.8 | 3.1 | 0.0 | 92.4 | ||
| Oct | Nov | Dec | Jan | Feb | Mar | Apr | May | |||||
| 1990-91 | 56.1 | 0.0 | 4.9 | 13.6 | 18.0 | 12.5 | 5.1 | 2.0 | 0.0 | 56.1 | ||
| 1991-92 | 63.5 | 0.0 | 1.9 | 21.8 | 13.4 | 14.9 | 10.4 | 1.1 | 0.0 | 63.5 | ||
| 1992-93 | 123.5 | 1.3 | 6.3 | 7.3 | 33.3 | 32.7 | 32.9 | 9.7 | 0.0 | 123.5 | ||
| 1993-94 | 173.6 | 3.0 | 15.1 | 28.1 | 55.1 | 30.8 | 38.9 | 2.6 | 0.0 | 173.6 | ||
| 1994-95 | 74.6 | 0.0 | 4.0 | 9.5 | 22.4 | 30.4 | 6.2 | 2.1 | 0.0 | 74.6 | ||
| 1995-96 | 165.7 | 0.0 | 39.0 | 49.0 | 36.5 | 7.2 | 30.1 | 3.1 | 0.8 | 165.7 | ||
| 1996-97 | 123.5 | 0.0 | 15.9 | 19.2 | 37.0 | 27.1 | 21.4 | 2.9 | 0.0 | 123.5 | ||
| 1997-98 | 112.7 | 1.7 | 24.8 | 32.5 | 17.7 | 27.1 | 8.9 | 0.0 | 0.0 | 112.7 | ||
| 1998-99 | 84.6 | 0.0 | 0.0 | 10.3 | 43.4 | 3.4 | 27.5 | 0.0 | 0.0 | 84.6 | ||
| 1999-00 | 67.7 | 0.7 | 9.0 | 8.6 | 23.6 | 13.4 | 5.4 | 7.0 | 0.0 | 67.7 | ||
| 2000-01 | 157 | 0.0 | 12.9 | 53.7 | 25.3 | 17.3 | 47.7 | 0.1 | 0.0 | 157.0 | ||
| 2001-02 | 57.5 | 0.0 | 0.2 | 6.6 | 22.7 | 11.7 | 12.7 | 3.3 | 0.3 | 57.5 | ||
| 2002-03 | 139 | 1.0 | 10.0 | 49.5 | 43.5 | 20.8 | 6.6 | 7.6 | 0.0 | 139.0 | ||
| 2003-04 | 121.4 | 0.0 | 8.0 | 42.0 | 44.9 | 14.9 | 11.2 | 0.4 | 0.0 | 121.4 | ||
| 2004-05 | 93.4 | 0.0 | 3.5 | 12.7 | 29.3 | 21.9 | 26.0 | 0.0 | 0.0 | 93.4 | ||
| 2005-06 | 106.8 | 0.0 | 3.7 | 45.8 | 15.4 | 27.6 | 14.3 | 0.0 | 0.0 | 106.8 | ||
| 2006-07 | 132.6 | 0.0 | 1.0 | 8.1 | 24.9 | 73.0 | 16.9 | 8.7 | 0.0 | 132.6 | ||
| 2007-2008 | 95 | 0.0 | 1.3 | 34.9 | 13.8 | 32.0 | 13.0 | 0.0 | 0.0 | 95.0 | ||
| 2008-2009 | 94.2 | 0.5 | 6.0 | 44.1 | 31.8 | 11.1 | 0.0 | 0.7 | 0.0 | 94.2 | ||
| 2009-2010 | 78.4 | 0.0 | 0.0 | 18.6 | 25.8 | 34.0 | 0 | 0.0 | 0.0 | 78.4 | ||
| 2010-2011 | 116 | 0.6 | 0.0 | 18.4 | 39.7 | 35.1 | 22.1 | 0.1 | 0.0 | 116.0 | ||
| 2011-2012 | 43.2 | 0.0 | 4.0 | 3.5 | 19.8 | 8.8 | 7.1 | 0.0 | 0.0 | 43.2 | ||
| 2012-2013 | 87.5 | 0.0 | 5.0 | 24.0 | 16.7 | 23.9 | 15.4 | 2.5 | 0.0 | 87.5 | ||
| 2013-2014 | 81.9 | 0.0 | 7.1 | 18.5 | 21.8 | 25.3 | 8.2 | 0.3 | 0.7 | 81.9 | ||
| 2014-2015 | 90 | 0.0 | 15.8 | 9.7 | 13.8 | 40.4 | 10 | 0.3 | 0.0 | 90.0 | ||
| 2015-2016 | 31.4 | 0.0 | 0.1 | 2.0 | 13.7 | 9.6 | 1.0 | 5.0 | 0.0 | 31.4 | ||
| 2016-2017 | 115 | 0.1 | 7.5 | 35.0 | 9.0 | 25.2 | 36.1 | 2.1 | 0.0 | 115.0 | ||
| 2017-2018 | 104 | 0.0 | 4.0 | 22.5 | 18.6 | 23.0 | 33.4 | 2.5 | 0.0 | 104.0 | ||
| 2018-2019 | 101.2 | 0.0 | 20.7 | 8.0 | 29.6 | 31.8 | 7.1 | 4.0 | 0.0 | 101.2 | ||
| 2019-2020 | 73.6 | 0.0 | 4.3 | 24.0 | 11.7 | 27.5 | 4.5 | 1.6 | 0.0 | 73.6 | ||
| 2020-2021 | 71.4 | 71.4 | ||||||||||
| 2021-2022 | 69.2 | 69.2 | ||||||||||
| 2022-2023 | 67 | 67.0 | ||||||||||
| 2023-2024 | 48.5 | 48.5 | ||||||||||
| NEW | 94.7 | 0.3 | 7.9 | 22.7 | 25.7 | 23.8 | 16.0 | 2.3 | 0.1 | 94.7 | ||
| OLD | 95.6 | 0.6 | 7.5 | 23.7 | 26.8 | 20.3 | 14.6 | 2.3 | 0.0 | |||
| OLDER | 98.1 | 0.6 | 9.9 | 22.2 | 27.1 | 18.8 | 14.3 | 3.9 | 0.2 | |||
| DIFFERENCE | -0.9 | -0.3 | 0.4 | -1.0 | -1.1 | 3.5 | 1.4 | 0.0 | 0.1 | |||
During the Trump years we were above normal on snowfall. Not by a lot, but we were above the 94.7″ mark for normal. Every year we went down a little bit. In 2019-2020, we dropped almost 30 inches and went below normal. Snowmobiling became tougher that year and basically every year since. 2020-21 was the COVID lockdown. 2021-22 we only had about 4-5 weeks in winter, with warm spells melting our snow. 2022-23 and especially 2023-24 just plain SUCKED. We need a change to get us back. What I described above is a good way to get us back.
Do we get back to 120? 140? 160? Probably not. However, I personally believe a make up year for snow is on the horizon. I believe at the very least we get back to at least 75″ for the winter. In a best case scenario, I can see us getting back up over 100″ in Utica/Rome for the first time since 2018-19. That would be great!
Official First Call Snowfall Forecast for the 2024-25 Season:
Chance of below normal snowfall (<75″ in Utica/Rome): 20%
Chance of normal snowfall (75″-117″ in Utica/Rome): 50%
Chance of above normal snowfall (>117″ in Utica/Rome): 30%
Yes, I am putting 80% of my 100% we will get at least 75″ of snow in Utica/Rome this winter. How the rest of the state works out? It all depends on the terrain and elevation. Some areas could turn out much better than others. Other areas may suffer. We will have to wait and see exactly how this goes.
A revision forecast to this will come out on Friday November 15th. Look for it.
Thank you!
Rich Lupia
Founder of Upstate Snow
November 1, 2024


