Hi everyone!
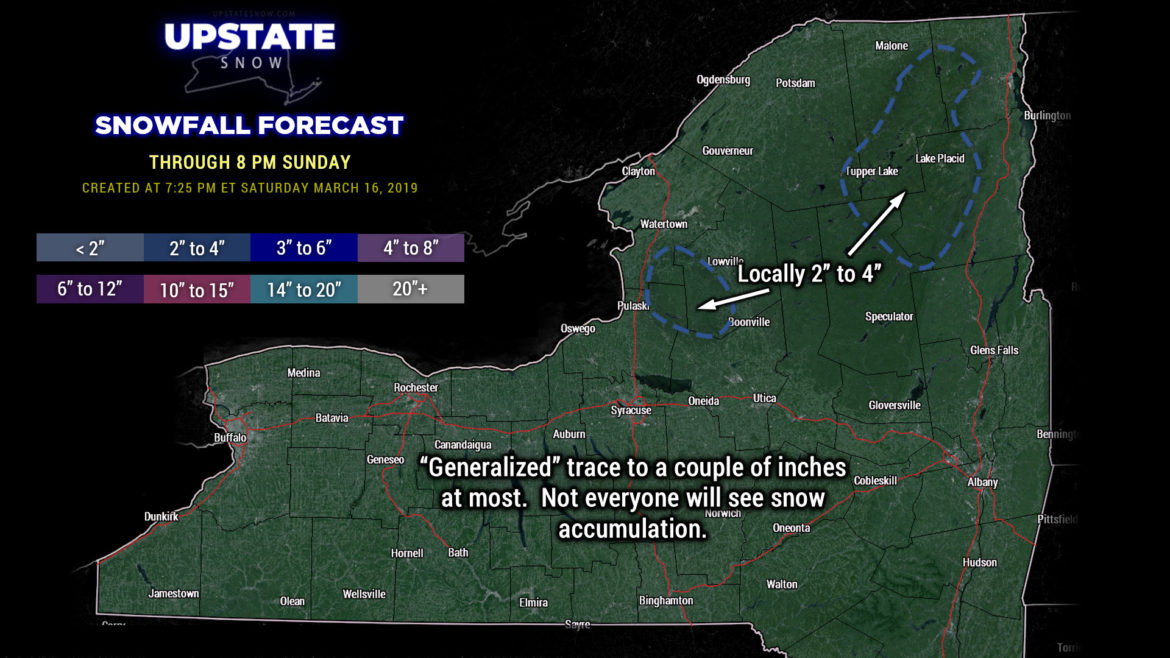
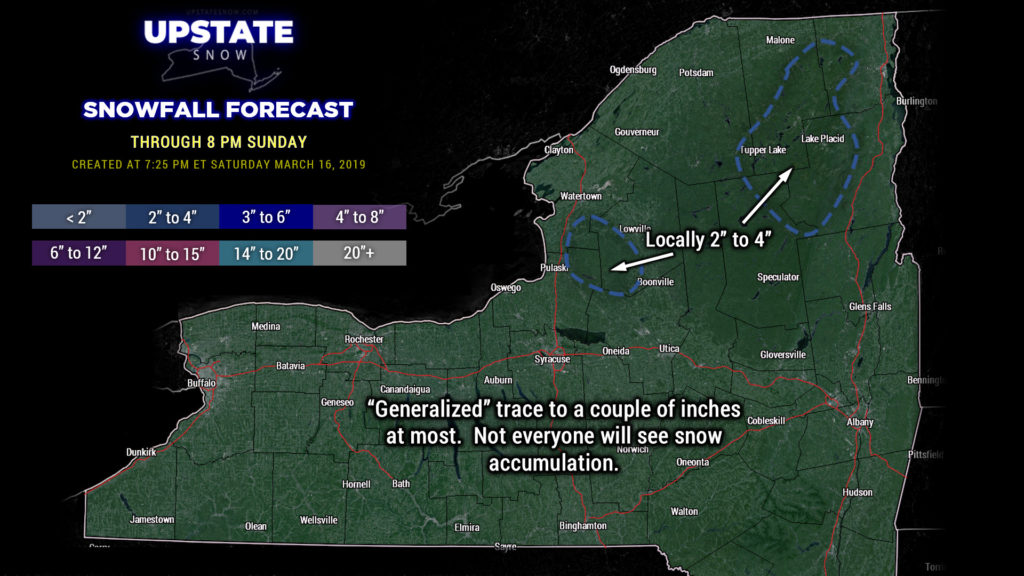
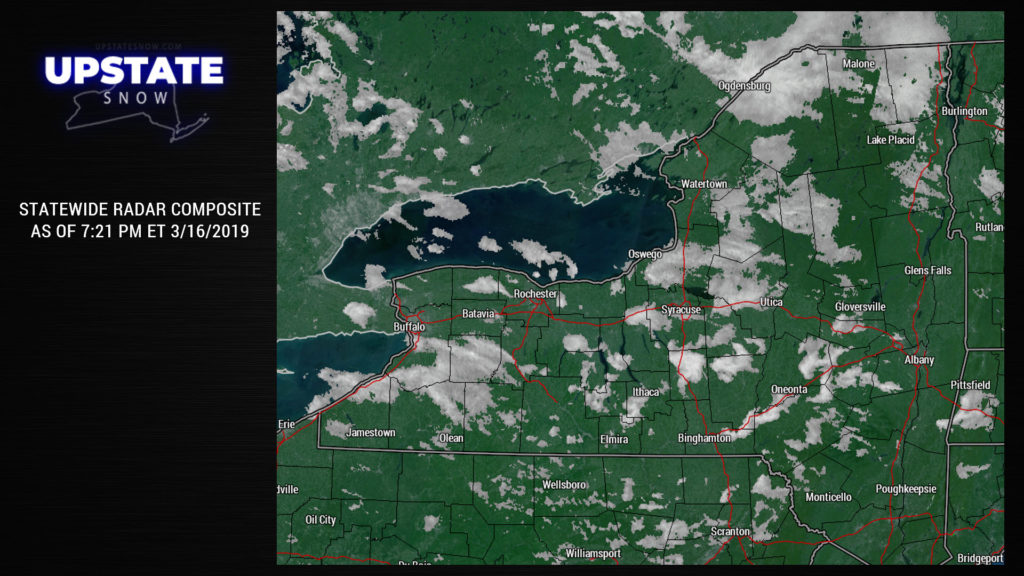
Scattered snow showers in a cold northwesterly wind flow persist across the state as of this writing. Not a lot of accumulation on general terms, but some isolated areas may pick up an inch or two of new snow through tonight through mid-morning on Sunday. Areas of the Tug and Adirondacks may pick up a little bit more thanks to upsloping in the mountains, and a bit of lake enhancement and upsloping on the Tug. By Sunday afternoon diminishes to just scattered flurries.
A little disturbance will drop across the area overnight Sunday night into Monday, bringing some more snow showers… which may mix with rain showers in some areas during the day on Monday. High pressure then takes control of our weather for Monday night into Wednesday. We’ll be cold Monday night, with temperatures early Tuesday morning ranging from the single digits over the Adirondacks to the lower and middle teens just about everywhere else (perhaps upper teens for the Hudson Valley. Temps begin to trend warmer again on Tuesday… highs generally in the upper 30s to lower 40s for most of the state (upper 20s to lower 30s over the North Country)… and by Thursday we’ll be in the upper 40s to lower 50s just about everywhere off the Tug and out of the Adirondacks.
Our next system approaches midweek… and as of right now this looks like it will bring rain and snow showers to the Upstate early Thursday through early Friday. The FV3 model wants to spin up a pretty potent low a couple hundred miles offshore, kicking back some rain/snow a lot farther back to the west than one would normally expect. The Euro also wants to spin up a low way offshore, but is much more sensible in precipitation placement. All in all this will probably be another nothing-burger.
==================================================
Where do we stand right now? The season is essentially over for all points south of the Mohawk Valley. In collaborating earlier today it was mentioned that there’s a “gut feeling” that there is more to come… but that is as unscientific of an assessment as can possibly be made. Besides, even if we were to get a system that brings a 3-6 or even 6-12 snowfall, it probably wouldn’t be worth it for clubs to go and re-groom trails… and with the sun angle the same as it would be in September, even if it’s a cloudy, blustery day, that 6-12 snow won’t last very long on the ground.
The business is still good on the Tug and in the Adirondacks, where we still have some decent snowpack. We took a look at some of the longer-range modeling to see some of the various “opinions” being offered for now through the end of the month. As you can see by the graphics, it’s… enlightening.
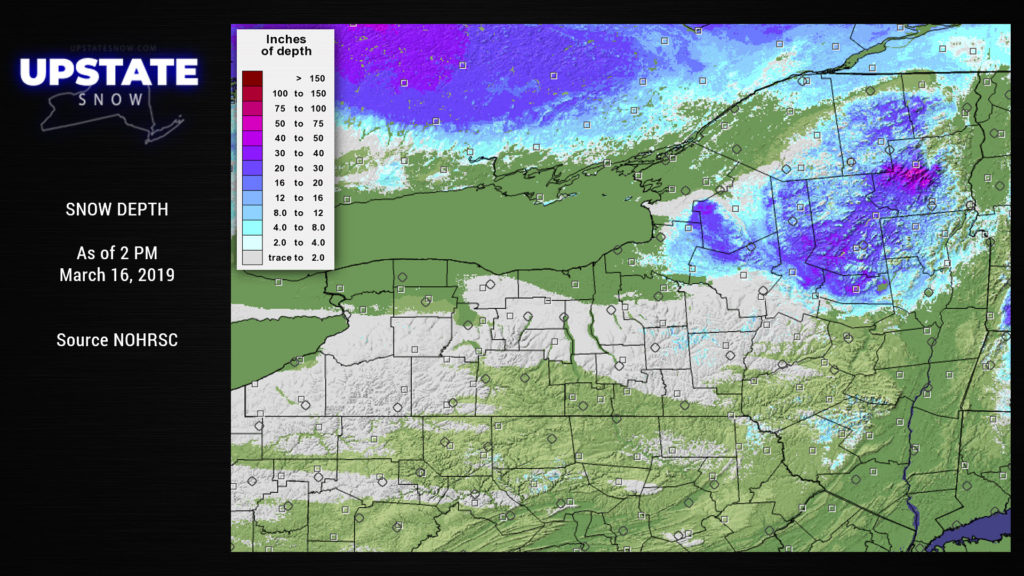
Here’s the latest snow depth chart from the National Operational Hydrologic Remote Sensing Center “Interactive Snow Information” site. This illustrates quite nicely where there’s snow… and where there is not.
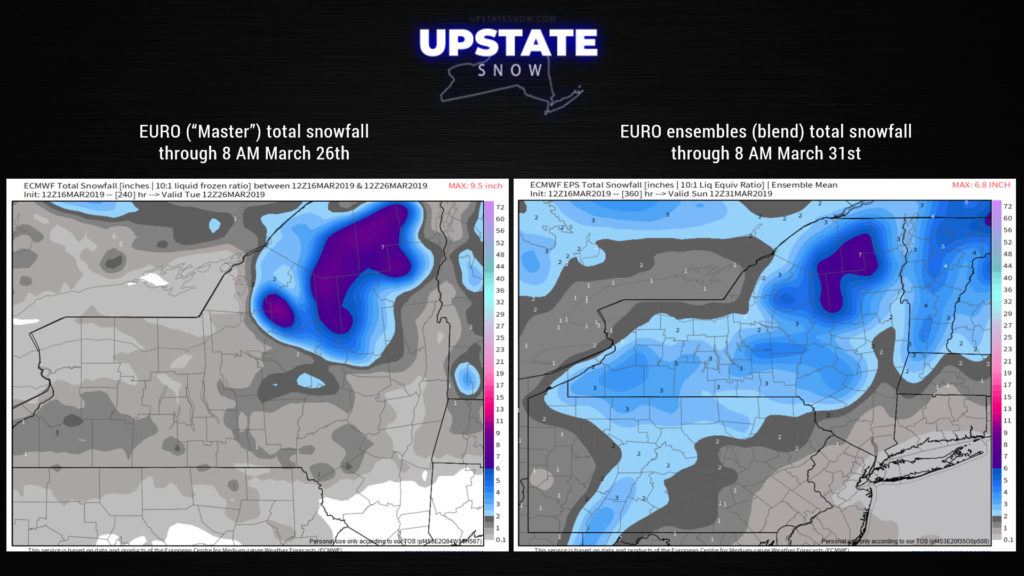
The European — both the master and the EPS (ensembles) target the North Country for accumulating snow for the rest of the month. The Euro ensembles are slightly more generous south of the Valley, but that’s only if you consider 2-6 inches to be “generous.” Certainly nothing that we’re going to ride on at this point. The Euro master is a bit more heavy-handed on the Tug and in the ADKs with up to 10 inches of new snow between now and the 26th.
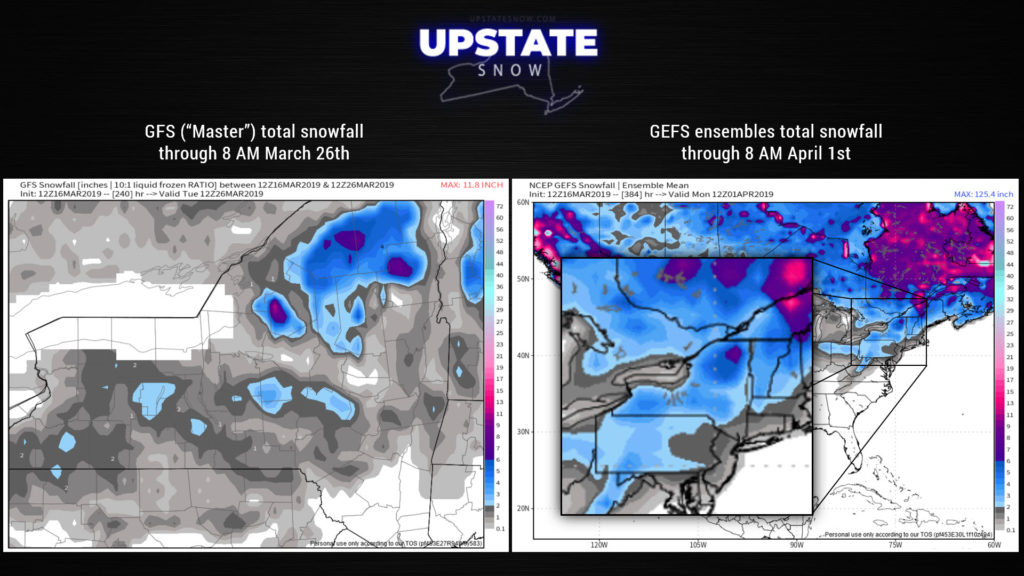
The GFS and GEFS (ensembles) aren’t very generous at all in terms of new snow through the end of the month. Once again the target areas are the Tug Hill and the Adirondacks… but on the ensemble blend, even that looks marginal at best.
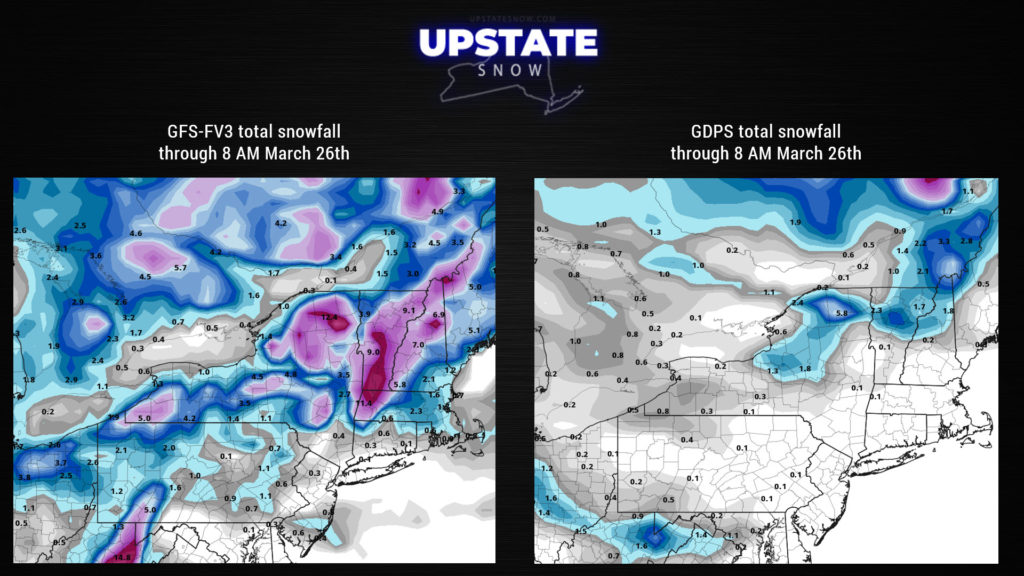
The last set of maps – the FV3 and the GDPS – are like night and day. I’m not really sure what the FV3 is smoking but it seems to believe that winter isn’t going anywhere anytime soon. That’s quite the outlier when compared to all of the other long-range data. The GDPS shows… barely anything outside of the high terrain in Franklin, Clinton, and Essex counties.
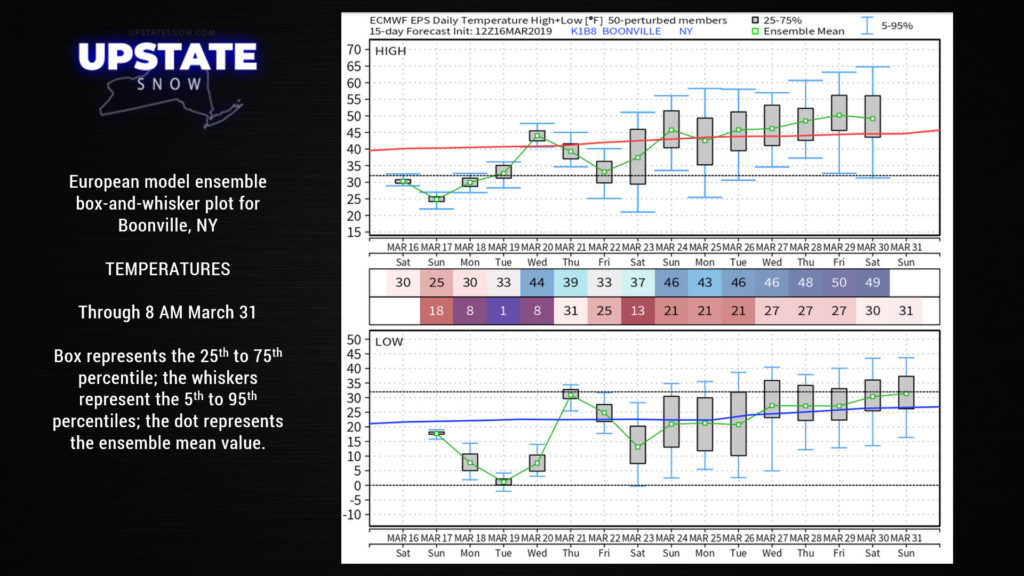
Next up for bids are some charts focused on Boonville, NY, chosen because it is in a generally “central” location. The European ensemble box-and-whiskers plot takes a look at temperatures through 8 AM March 31. What stands out is the very wide ranges between the 5th and 95th percentiles (the whiskers). Now, normally you would see fairly wide ranges as you go farther out in time, but… for example on March 23, the highs could range from the lower 20s to the lower 50s… mid 20s to upper 50s on the 25th, and lower 30s to mid 60s on the 30th. Lows cound range anywhere from the lower single digits to near 40 on the 26th. Again, those are the extremes. We want to focus on the boxes, that’s where most of the ensemble members cluster their results. The tighter the cluster (the smaller the box) the more “confidence” we have in that particular result.
(A little bit about model ensembles — you have the model, such as the European model. The “control” is like the conductor to an orchestra. Your orchestra is, of course, an ensemble of instruments. Ok? So each member of the ensemble is a “European model” but one of the starting calculations is tweaked a little bit differently, producing a different result. There are 50 ensemble members of the European model.)
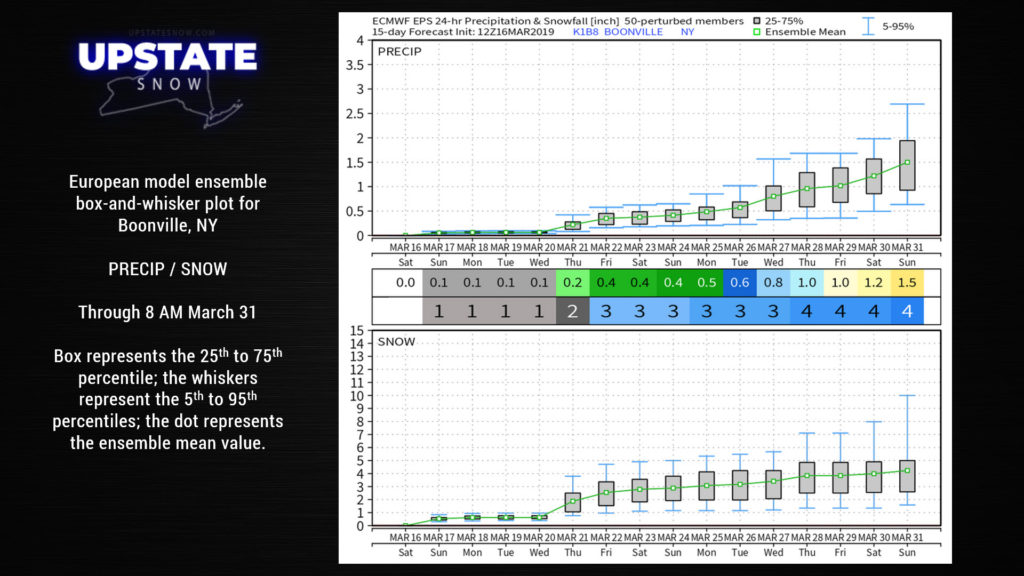
Next up is a box-and-whiskers plot for precipitation and snowfall, again the European orchestra. One thing that catches the eye is the last snowfall plot — hmm THAT looks interesting.
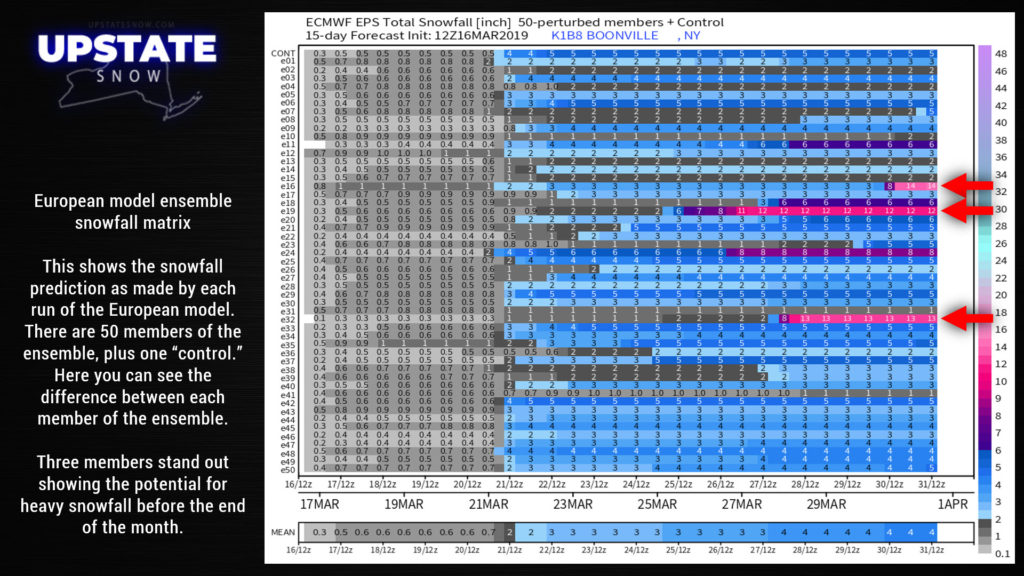
And it’s good that we can break things down even more and take a look at a “snowfall matrix chart.” This lets us take a glance at ALL 50 of the Euro ensemble pieces to see who is going bonkers on a snowfall total toward the end of the period. Ensemble members #16, #19, and #32 seem to have been enjoying St. Patrick’s Day festivities a bit too soon. But it also means we can’t completely slam the door on snowfall the rest of this season. At least in Boonville.
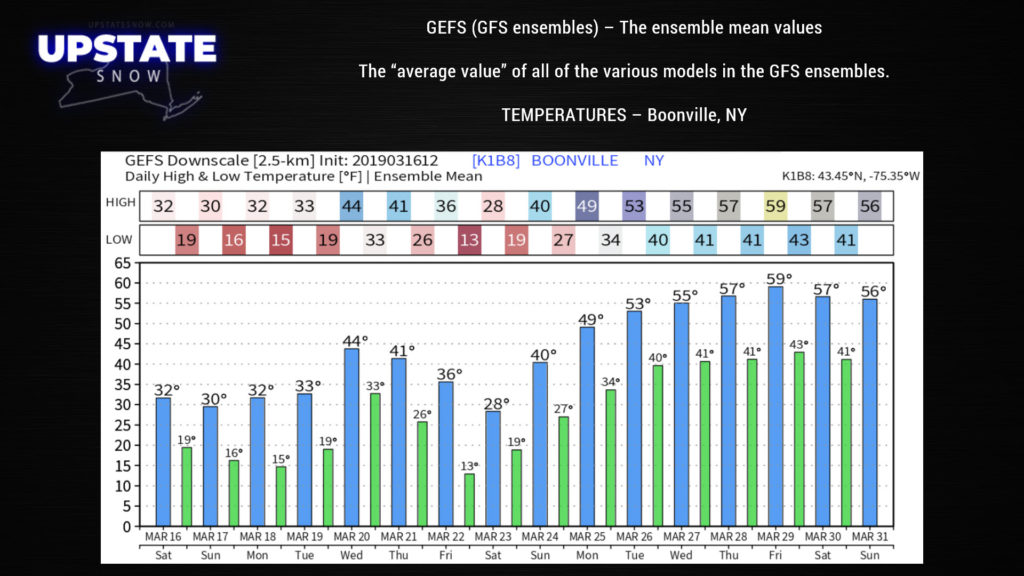
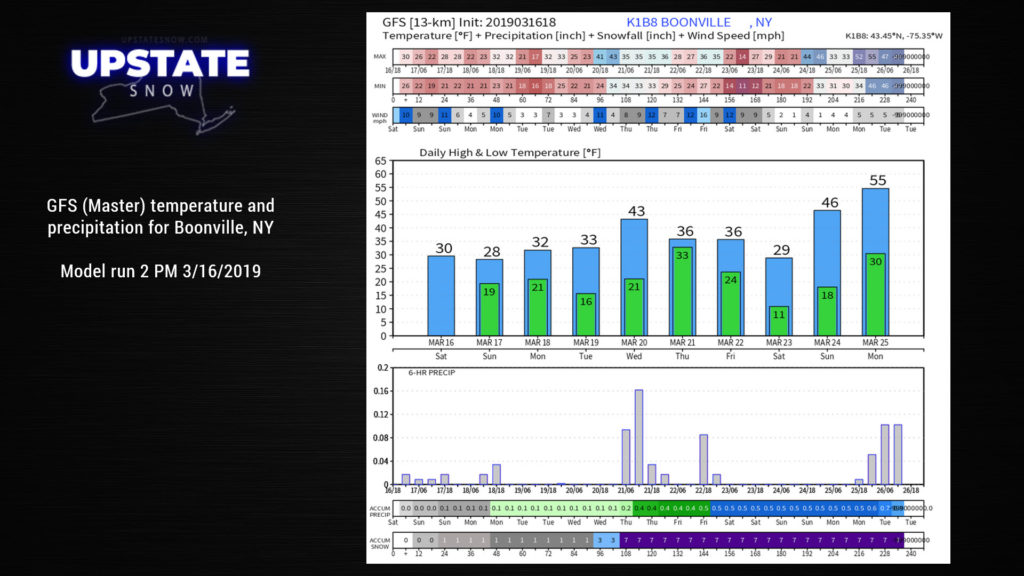
The GFS and GFS ensembles really pop our balloon though — the ensemble averages point to a pretty cold weekend NEXT weekend, followed by the full onslaught of springtime. The GFS “master” interestingly shows a bit of a snowfall with that system Wednesday night through early Friday next week, followed by a cold weekend, before the big warmup.
Now, it needs to be said — ALL of this … is simply model data. Once you get farther than a week out, it really becomes nothing more than an educated guess. Models can (and do) change from day to day, or even run to run. We have compared these to runs from earlier today and they are similar… but that doesn’t mean that tomorrow the whole thing won’t be turned on its head. So there’s the asterisk behind all of this.
And finally, for fun, here’s a map of the total snowfall from October 1, 2018, through March 16, 2019.

We’re going to continue to post our updates. The primary focus, again, will be on the Tug Hill and the Adirondacks, because those are really the only areas left for riding. If by some crazy fluke the outlier FV3 turns out to have some truth behind it, it’s still doubtful that places south of the Thruway will be open for riding again this season.

