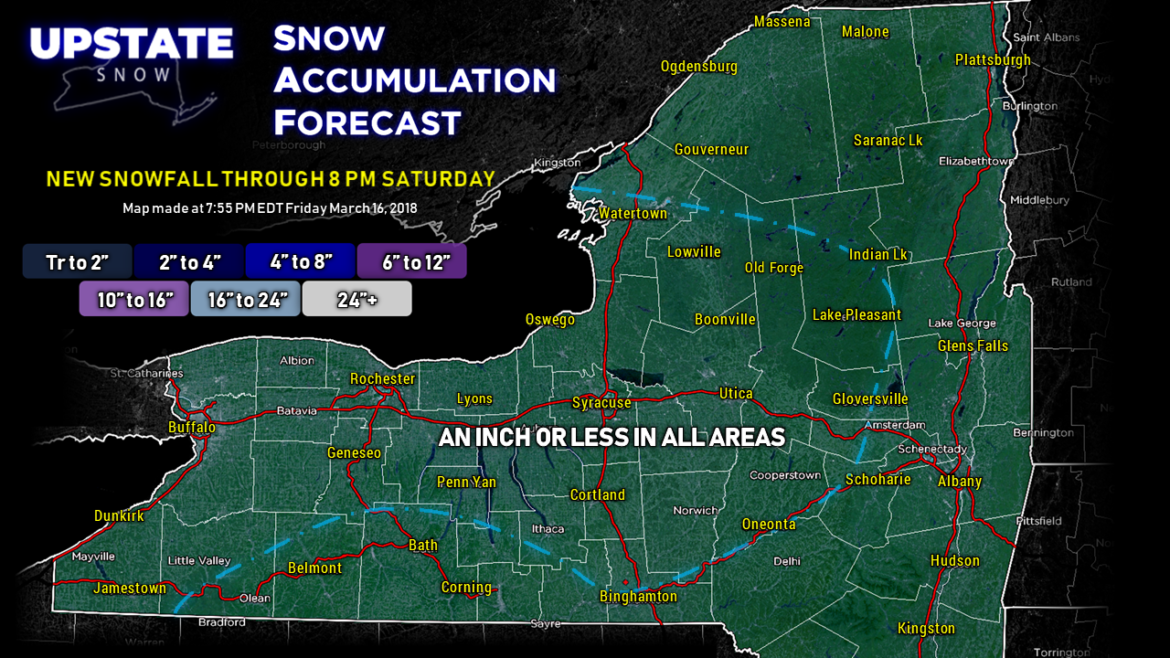
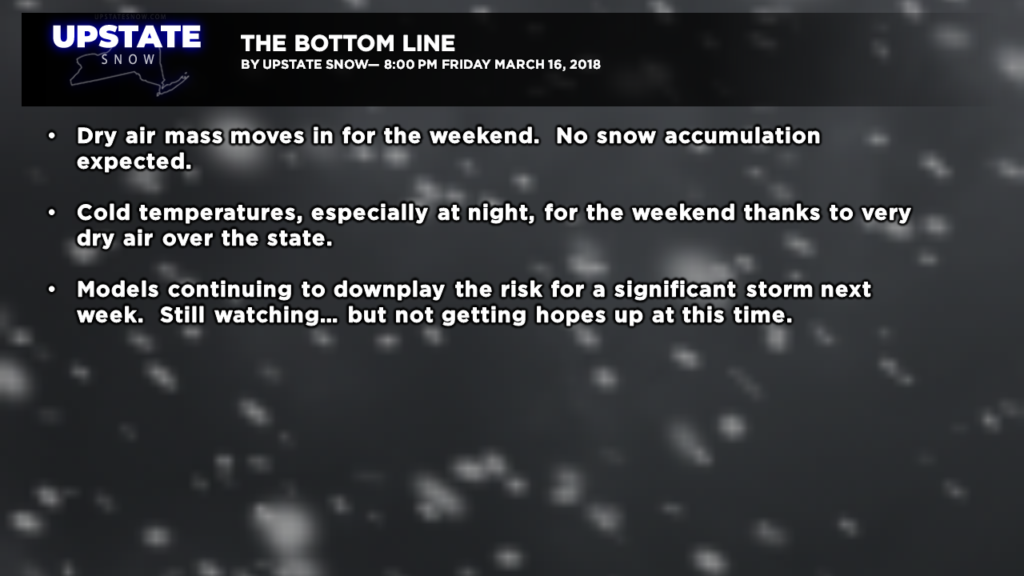
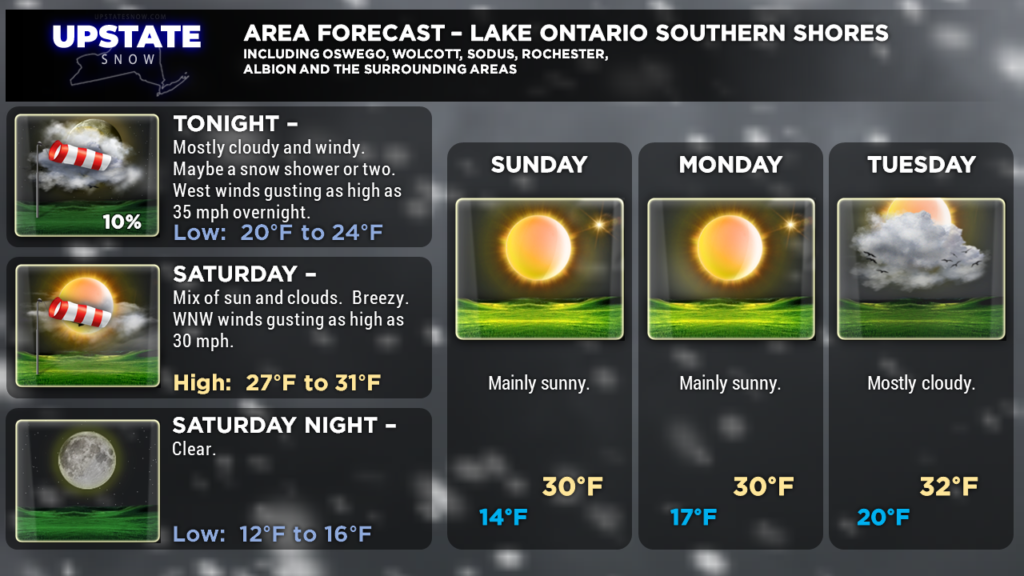
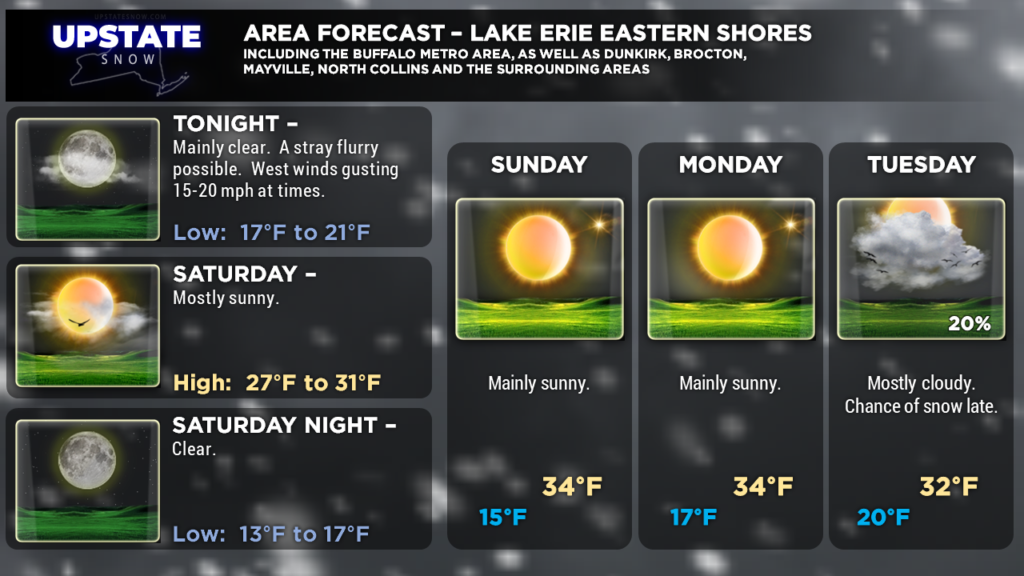
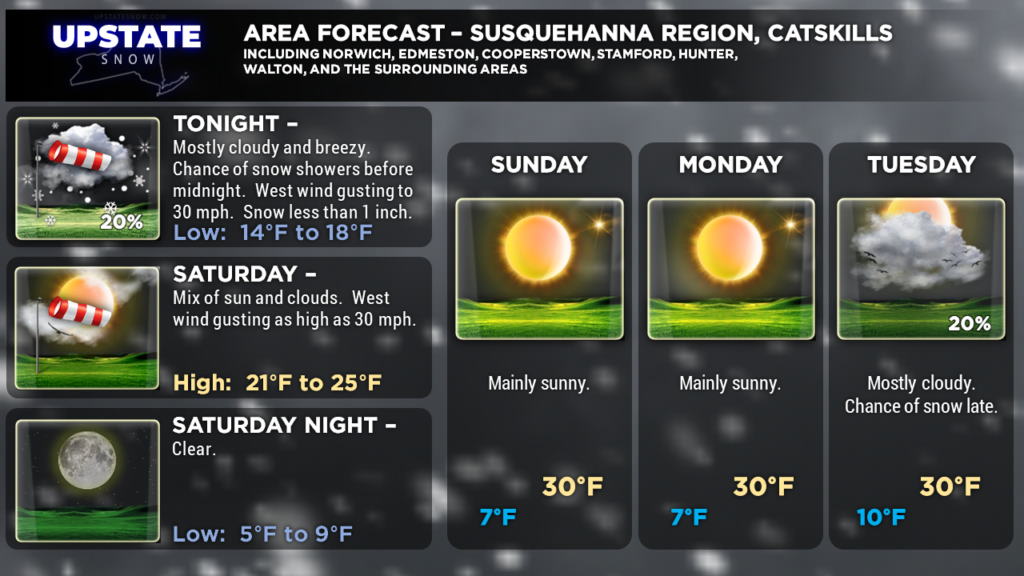
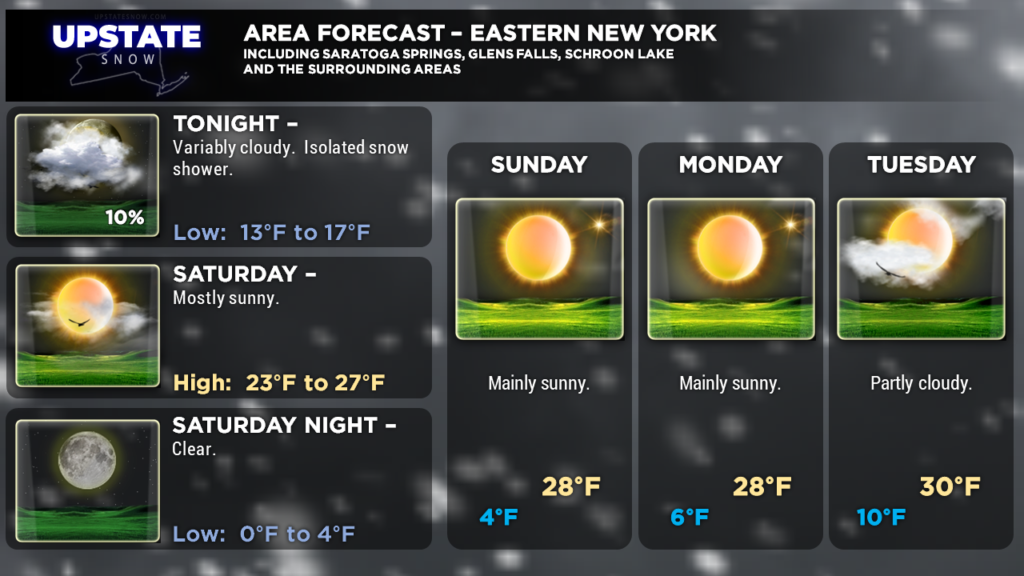
Good evening! In the world weather, there’s not much to talk about tonight. Nor will there be much to talk about the next several nights as a prolonged period of generally dry (and COLD) weather will persist. Lake effect snow showers and flurries will end early tonight and skies will clear out from southwest to northeast as a dry air mass builds in from the west.
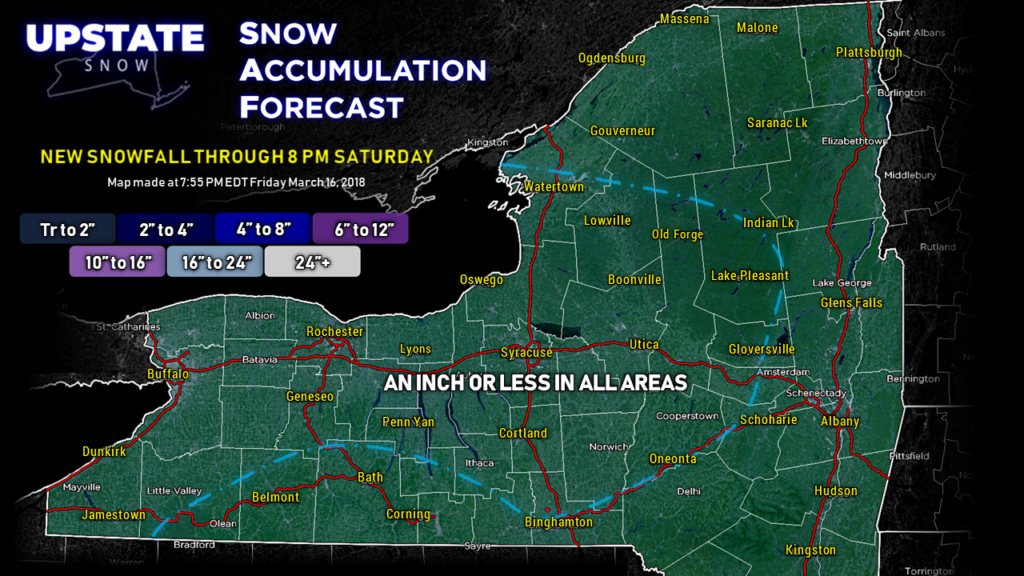
While there are scattered snow showers around, accumulations statewide will be an inch or less.
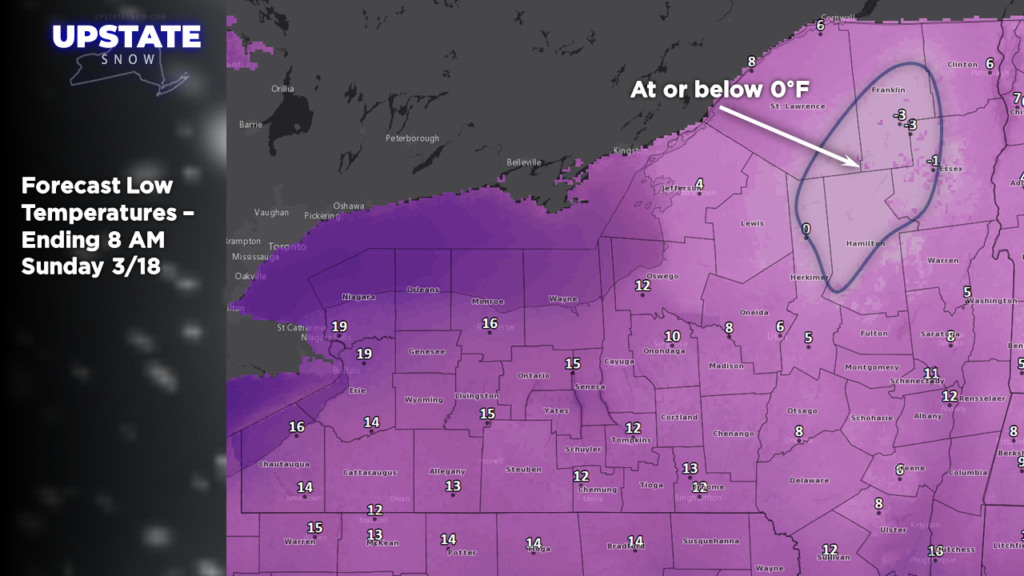
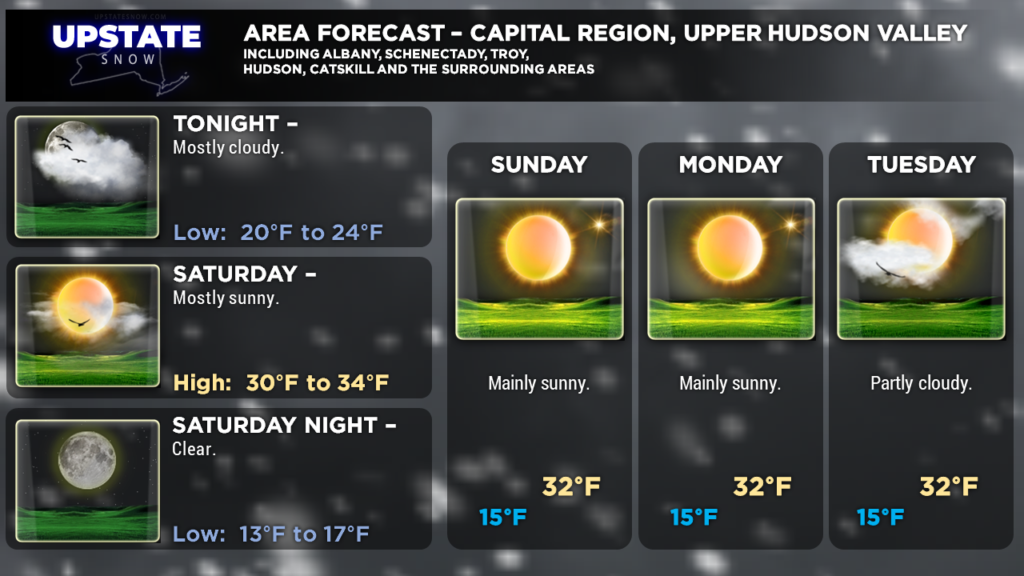
It really becomes a temperature forecast at this point through the weekend. Surface high pressure building over the region later Saturday into Sunday means we will see clear skies Saturday night… and with that nice fresh deep snow cover, temperatures will tumble Saturday night / Sunday…. widespread lows in the single digits and teens are expected…. and some areas of the northern Adirondacks may even dip below zero.
Afternoon highs Sunday will rebound into the mid and upper 20s far north to the lower 30s for the southern tier and NY/PA border counties.
Below normal temperatures are likely to continue through much of the upcoming work week, with daytime highs generally no warmer than the lower or middle 30s (upper 30s Capital region), 20s for the Adirondacks, and morning lows in the teens. Definitely a mid-winter pattern!
Now… about that storm…
There’s still all kinds of uncertainty with this… even more than what would be considered “normal.” The GFS model from 8 AM this morning comes a bit farther northward / westward with a center of low pressure off the Jersey coast by 8 AM Wednesday. This would bring accumulating snows to NY from roughly Glens Falls southwest through perhaps Elmira, with the highest impacts being in the Catskills. That was the 8 AM run of the model.
The 2 PM run of the model has the low much farther east… southeast of Cape Cod, with a second low just off the southeast NC coast. Snows extend from central NC through Virginia before hitting dry levels in central PA. This run shows absolutely nothing hitting anywhere in the Upstate Snow region. Interestingly it strengthens the second low off the Delmarva before pulling it away as well.
The Canadian model from 8 AM today takes a low over the south-central plains, moves it to roughly the Tennessee/NC border, while a secondary storm develops off the NC coast — very much a “Miller-B” storm pattern. This storm also takes an east-northeast route out to sea, bringing accumulating snows no farther northward than central PA, central NJ.
Just for fun we took a look at the ICON model, which is a German variant of the European suite of models. This also gives us a Miller-B presentation and a center of low pressure very close to the Jersey coast by Wednesday morning. Theoretically this would mean snow for at least eastern/southeastern NY.
Finally, the European model from 8 AM today… shows an area of low pressure forming near Fayetteville, NC, and then moving well out to sea, with absolutely nothing… nada… zilch… in the way of snow accumulation here.
So on the whole it is appearing less likely that we will have a fourth nor’easter impact the Upstate. But we’re not ruling it out yet either. We’re still five days out. The storm(s) we’re talking about haven’t even developed yet… so we’re dealing with hypotheticals and a lack of data. Our forecast models can only work with the data they’re given… various ensembles of the GFS and European model take this thing all over the place.
Working AGAINST a storm impacting our area is strong high pressure to our north. Models bring this a little farther south with each run, and this strong, dense high pressure will make it difficult for storm systems to make any headway… but again this is really all speculation.
Hopefully by Sunday we’ll be able to make heads or tails of model data and give a more definitive outlook on this. Until then… it’s a case of “stay tuned.”
Models, models, models. Ensembles. Model data. Since it’s a slow weather day, we decided to delve into some of the science of weather models. If that’s not your gig, that’s cool, scroll on down where the zone forecast graphics are posted.
SCIENCE ALERT!!!
How often have you heard or seen this? Jimmy Jimjam has a Facebook page, like everyone else. He sees someone share a picture of a weather model depicting a catastrophic [name-your-weather-event] impacting an area of the country, about 9 days from now. Mr. Jimjam posts a screenshot of that model, with lots of pretty colors and lines… the whole “OMG” effect. Mr. Jimjam suddenly gets lots of “likes” and “shares” of his post. He feels loved, special, all warm and fuzzy inside. Fast-forward 8 days and not only is the aforementioned storm not in the same location, but it is absolutely nothing like what Mr. Jimjam posted in the first place. Of course, Sir Jimjam is nowhere to be found on social media.
This scenario is maddening to meteorologists everywhere, because people take that one snapshot of one moment in time, without any context, and run with that football.
Well, instead of making a single forecast based on one model image from one moment in time, meteorologists will look at model ensembles. Instead of one model, or one snapshot, there is a set, or ensemble, of forecasts produced. Our atmosphere is a liquid, and is in an ever-evolving state. Nothing is truly stationary, or non-moving. Our job as forecasters is to predict temperature, dewpoint, precipitation, winds… all characteristics of many 3-dimensional “pieces” (known as “parcels” in the business) for one moment in time either several hours or several days in the future.
So we use ensembles to get an idea of all the various possible future states of a particular parcel (or region of parcels, such as Upstate New York).
Running model ensembles is a form of something called the “Monte Carlo analysis.” (No, not the brand of automobile produced by Chevrolet.) “Monte Carlo methods (or Monte Carlo experiments) are a broad class of computational algorithms that rely on repeated random sampling to obtain numerical results. Their essential idea is using randomness to solve problems that might be deterministic in principle” (Kroese et al).
Bringing this back to weather, the European model, for example, gets run 50 times. Before each run, though, one of the initial conditions used in calculations (a condition such as a set of temperatures in southern California — it’s not that simple but suffices for this discussion) is “tweaked” (the technical word is “perturbed”). Running the model multiple times accounts for the two usual sources of uncertainty in forecast models: (1) the errors introduced by the use of imperfect initial conditions — such as a bunch of malfunctioning sensors in Oklahoma report temperatures about 40 degrees higher than they actually are; and (2) errors introduced because of imperfections in the model formulation, such as the approximate mathematical methods to solve the equations.
You’ll oftentimes see model ensemble output on a weather map during the summertime when meteorologists show the “spaghetti plot” for potential hurricane paths. This is an excellent example of looking at a model ensemble.
Imperfect initial conditions: Initial condition uncertainty arises due to errors in the estimate of the starting conditions for the forecast, both due to limited observations of the atmosphere, and uncertainties involved in using indirect measurements (satellite data) to measure the state of atmospheric variables. In other words, there aren’t weather stations everywhere. This is something that New York tried to address with the NY Mesonet, but the coming-about of that system is another discussion for another time. Anyway… initial condition uncertainty is represented by tweaking (changing the numbers) of the starting conditions between the different ensemble members. Lets say that Utica is reporting a temperature of 28 degrees with moderate snow falling… we “tweak” that to say Utica is reporting a temperature of 36 degrees, and leave everything else alone, and then run the model again to see what it spits out.
Model uncertainty: Ever try taking a “staged photograph” of a small child or a pet … they won’t hold still! Well guess what? The atmosphere doesn’t hold still, either. Model uncertainty arises because, simply, there are limitations in our forecast models. The process of representing the atmosphere in a computer model involves many simplifications such as the development of parametrization schemes, which introduce errors into the forecast. (Parametrization is a method of replacing processes that are too small-scale or complex to be represented by the weather model by a simplified process. It’s essentially making an “educated guess” as to such things as localized thunderstorms, or localized snow squalls, and their impact on conditions later on.) The computer makes assumptions.
So at the end of all of this, we get a RANGE of possibilities. Unless you like looking at sheets and sheets of just raw numbers, the data isn’t really useful to “the public.” People like Dr. Ryan Maue of WeatherModels have the ability to make that data useful for meteorologists, who can, in turn, explain it “in plain English” to the viewing public — that’s you!
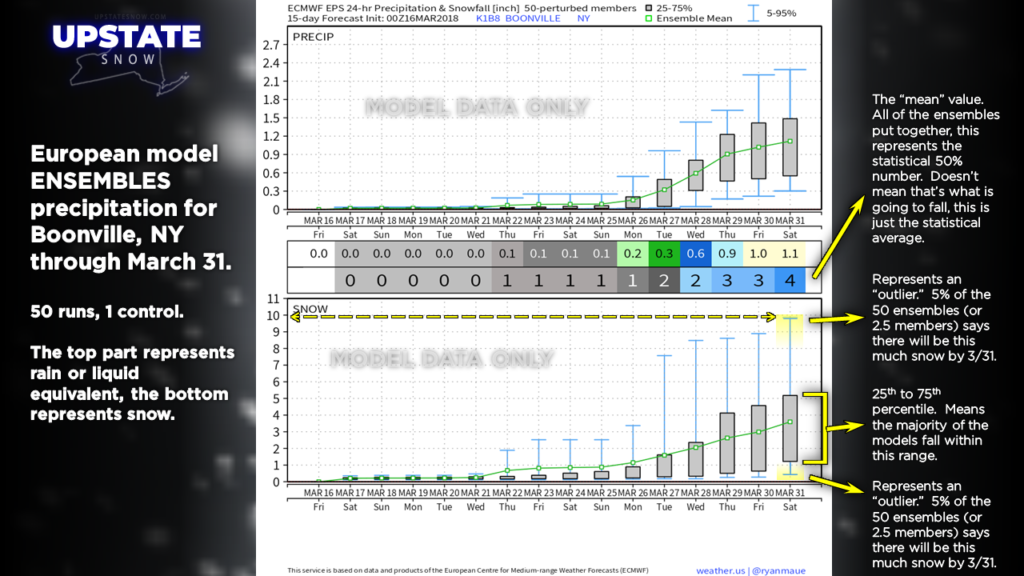
Here’s an example of the results of running the European model 50 times, getting an ensemble, of precipitation for Boonville, through March 31.
This is by no means a “forecast,” but simply a visual representation of the results. The top part indicates liquid equivalent or rainfall, and the bottom indicates what the MODEL thinks could fall as frozen precip. Now, we think of this as “snow,” and the model doesn’t make any effort to differentiate between sleet or snow… so you can’t just take a number from here and preach it from the pulpit on Sunday morning.
We highlighted some parts — the outliers (those rogue members who have been hitting the bottle too hard), the 25th to 75th percentile (the majority), and then the ensemble mean. The tighter, or closer together, the gray bar is for the 25th to 75th percentile, the better agreement there is on part of the ensembles, and the higher likelihood of that being the final observed total. When you have a very wide range in your graph (for March 31 — from 10 inches of snow to about a third of an inch of snow), this is what we’re referring to when we say “there is disagreement in the models.”
At this point it is up to the meteorologist to look at this (and ensemble results from other models as well), as well as all the other factors such as upper air data, satellite imagery, and yes, looking out the window, as well as years of education and experience… to make a forecast that HOPEFULLY will be CLOSE to being correct after about 3-4 days out. (The farther out in time you go, the less likely your forecast is going to be “accurate.”)
Model ensembles are made at the major meteorological facilities worldwide — National Centers for Environmental Prediction (United States), European Centre for Medium-Range Weather Forecasts (ECMWF), the United Kindgom Meteorological Office, Meteo-France, Environment Canada, Japan Meteorological Agency, Bureau of Meteorology in Australia, China Meteorological Administration, Korea Meteorological Administration, and CPTEC in Brazil! They are also done by some universities, as well as by the US Navy and Air Force.
—–END SCIENCE—-
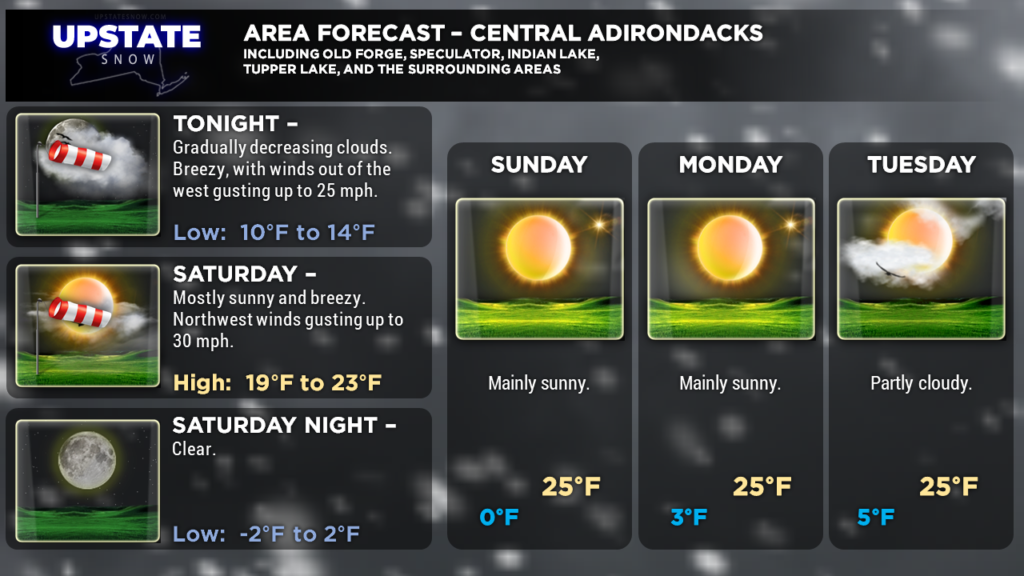
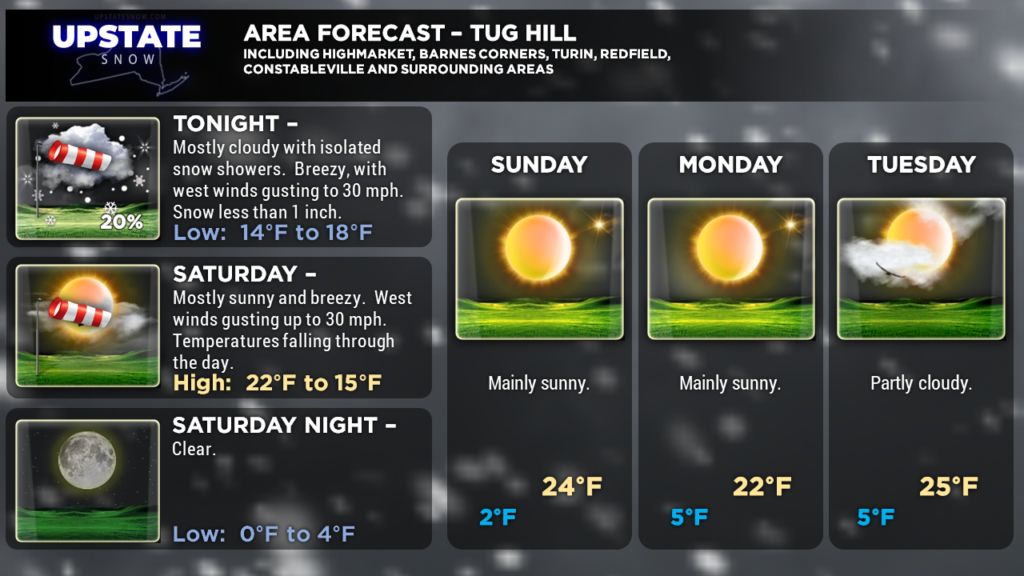
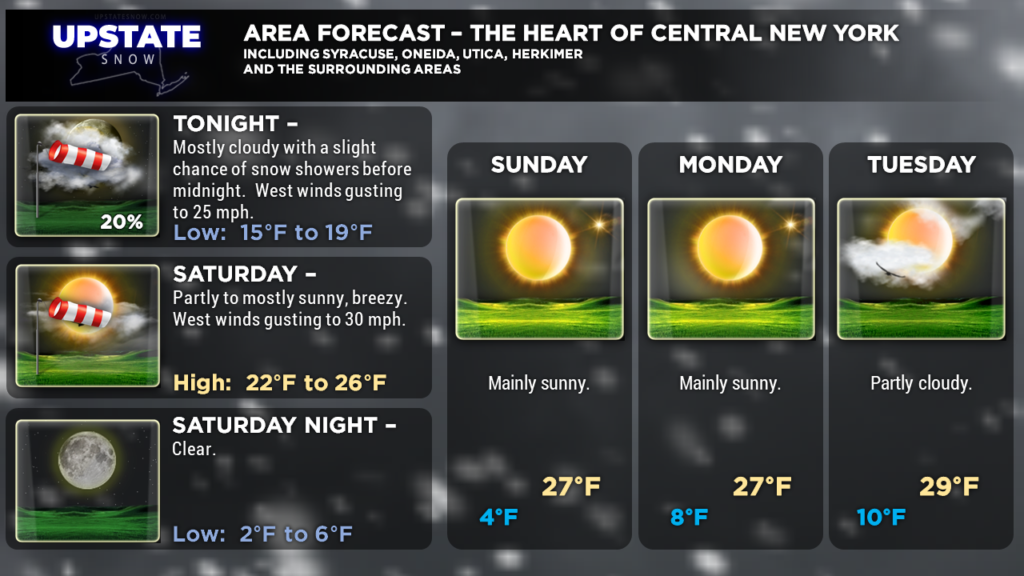
Here are your zones… have a great evening, thanks for viewing, thanks for supporting our sponsors, and have a GREAT WEEKEND RIDING!!

